Online Learning Trends and Highlights - Spring 2025
The following overview of online learning trends at NIU offers a glimpse into the current state of online learning and highlights a few of the current online learning trends as of Spring 2025.
Online Program Enrollment
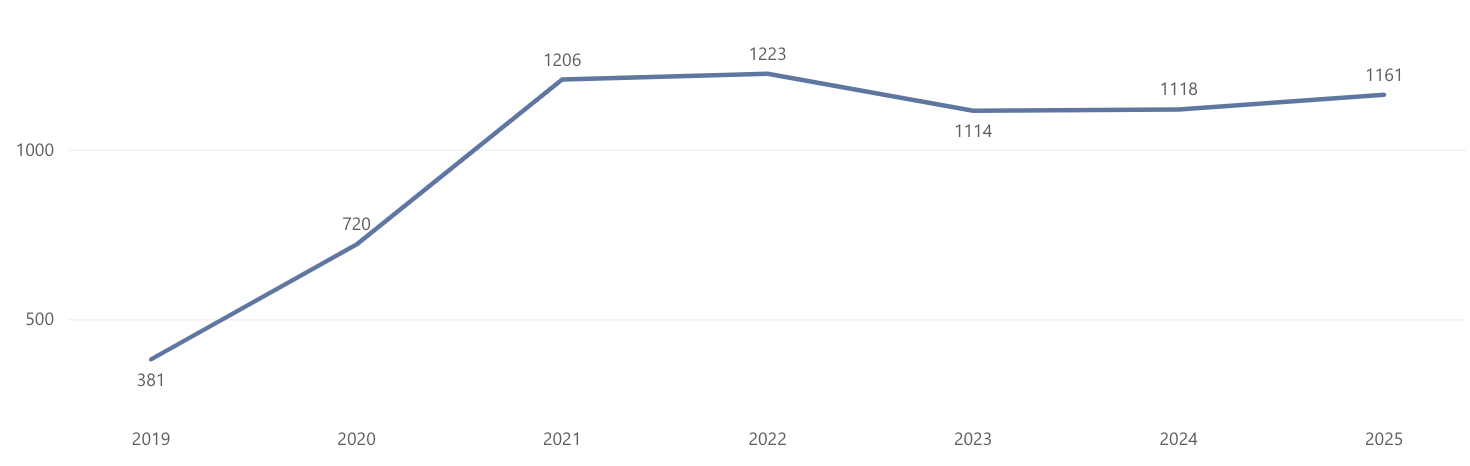
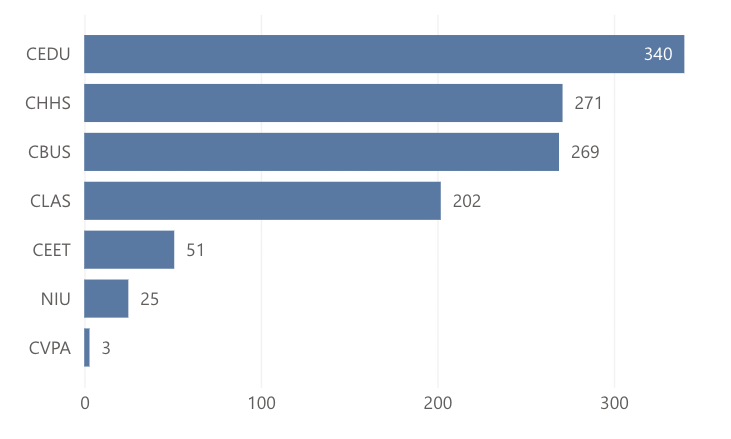
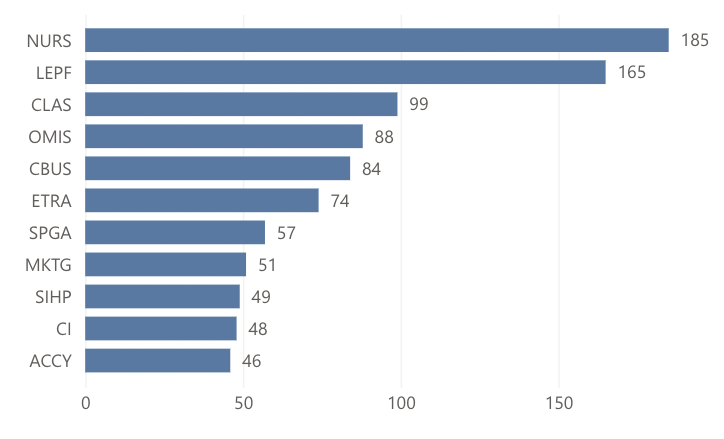
Online program enrollment remains strong, with 1,161 students enrolled in NIU online programs in Spring 2025, up slightly from the enrollment of 1,118 in Spring 2024. Online program enrollment trends over the past seven years are provided below, along with online program enrollment by college and department in the Spring 2025 semester.
Enrollment by College
Enrollment by Department (Top 11)
Student Preferences for Online Courses
Online Course Enrollment
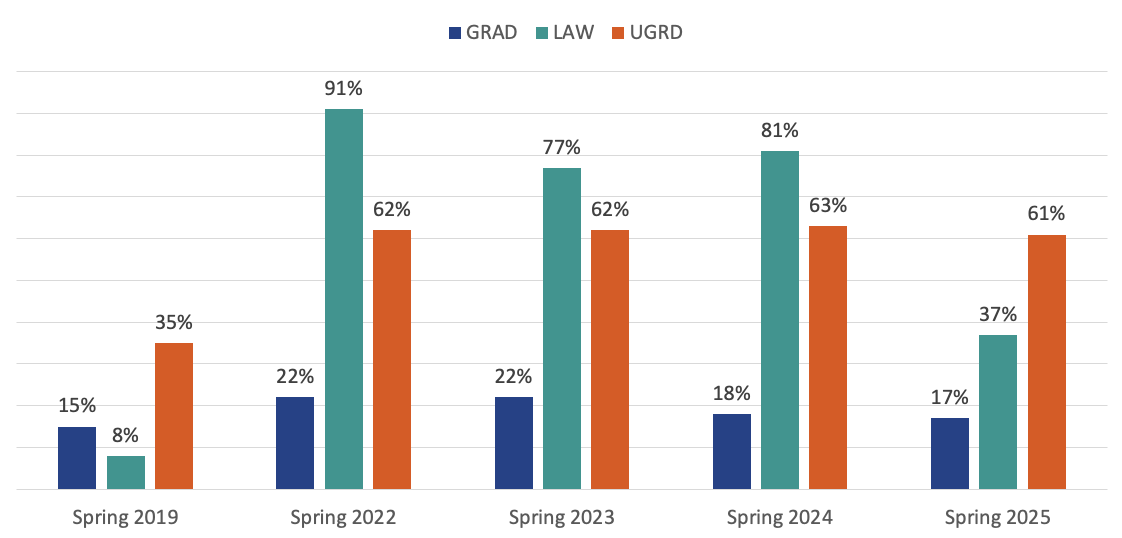
Considering student preferences for taking online courses and compare pre-pandemic vs. current enrollment and student credit hours in online courses, it’s clear that student demand for online courses remains strong. Looking at student enrollment in online courses, in Spring 2019 (pre-pandemic), 35% of NIU undergraduate students and 15% of NIU graduate students took at least one online course. In Spring 2025, 62% of NIU undergraduate students (6,348) and 18% of NIU graduate students (591) took at least one online course.
6 in 10 undergraduate students and 1 in 5 graduate students took at least one online course in Spring 2025
Percentage of NIU Students Taking At Least One Online Course
Program Format Preferences
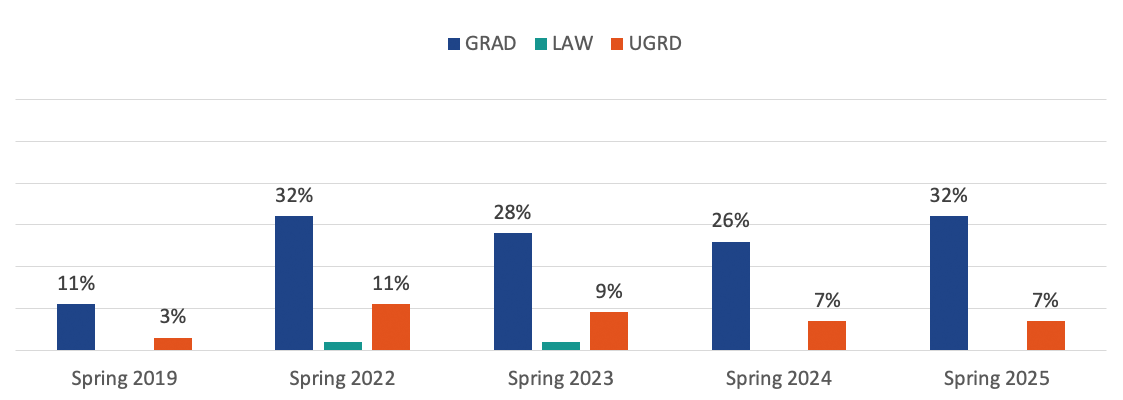
NIU students still predominantly prefer in-person and hybrid programs to fully-online programs. In Spring 2024, only 7% of undergraduate students (716) and 32% of graduate students (1,107) graduate students took only online courses. This is up from 3% of undergraduate students (374) and 11% of graduate students (440) pre-pandemic in Spring 2019.
Percentage of NIU Students Taking All Online Courses
Online Student Credit Hours
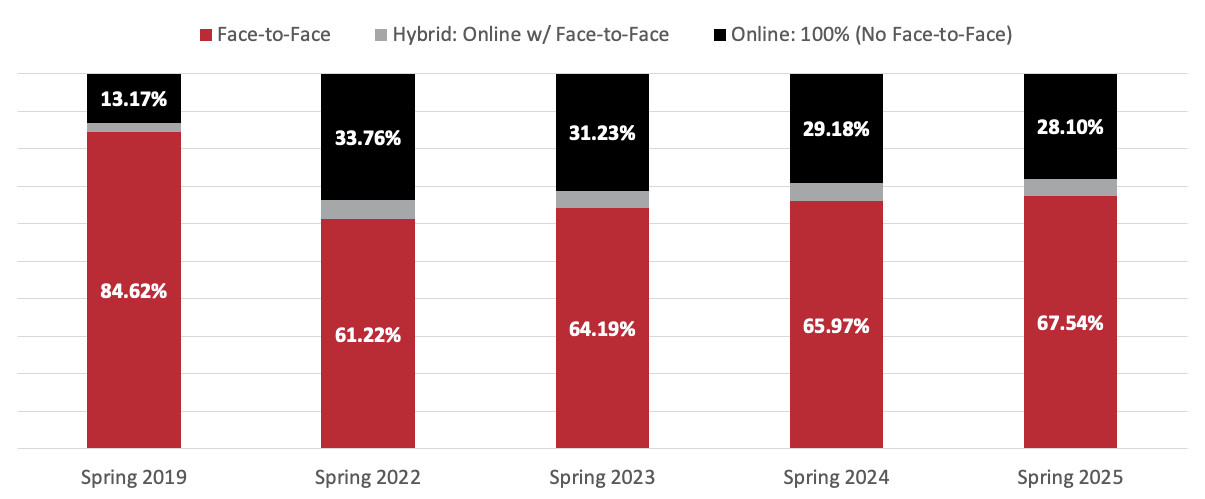
Similarly when looking at student credit hours (SCH) by mode of instruction, we continue to see a similar trend for students completing a higher percentage of credit hours through online courses as compared to pre-pandemic years. In Spring 2019 (pre-pandemic), 13.1% of all SCH were from online courses and 2.2% were from hybrid courses. In Spring 2025, 28.10% of SCH were from online courses and 4.37% were from hybrid courses.
Student Credit Hours (SCH) by Term and Instruction Mode
Faculty Teaching Online Courses
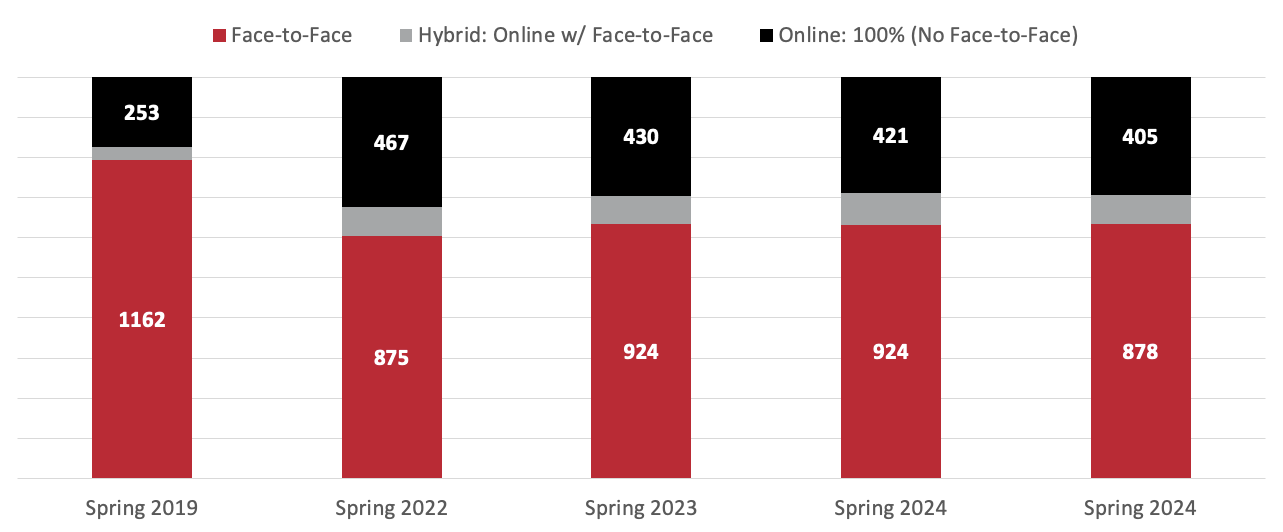
As expected when looking at faculty teaching online courses and comparing pre-pandemic offerings of online courses to current, we see a significant increase in the number of NIU faculty who are teaching online and hybrid courses. In Spring 2019 (pre-pandemic), 49 faculty taught hybrid courses and 253 faculty taught online courses, as compared to Spring 2025, in which 102 faculty taught hybrid courses and 405 faculty taught online courses.
Of all 1,213 faculty (including all categories of faculty and teaching staff) who taught during Spring 2025, 33.3% (405) taught at least one online course and 8.4% (102) taught at least one hybrid course.
1 in 3 faculty taught at least one online course and 1 in 12 faculty taught at least one hybrid course in Spring 2025
Faculty of Record by Course Mode of Instruction
Professional Development and Support for Online Teaching
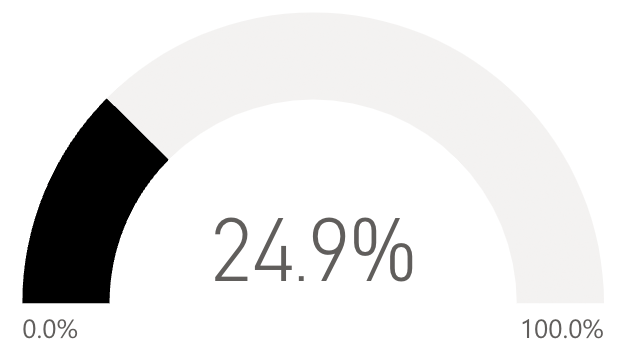
Faculty who teach online courses continue to utilize available online teaching support at NIU. In reviewing faculty participation in professional development and support for online teaching, of the 405 faculty who taught at least one online course and the 102 faculty who taught at least one hybrid course during Spring 2025, 70.6% have received some type of individualized support for their online teaching, 53.0% have attended faculty online teaching workshop(s), and 24.9% have completed the Online Course Design Academy during the past five years.
Percentage of Faculty Teaching Online in Spring 2025 Who Received Individualized Support During the Past 5 Years
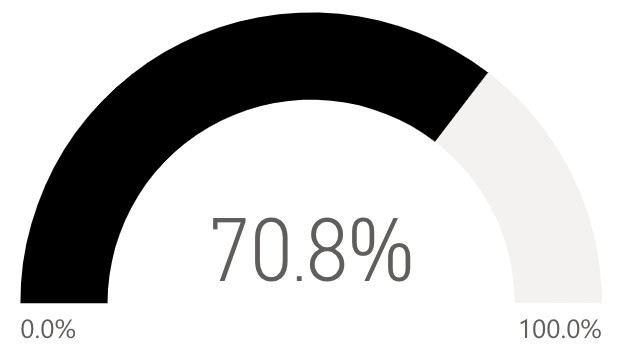
Percentage of Faculty Teaching Online in Spring 2025 Who Attended Online Teaching Workshop(s) During the Past 5 Years
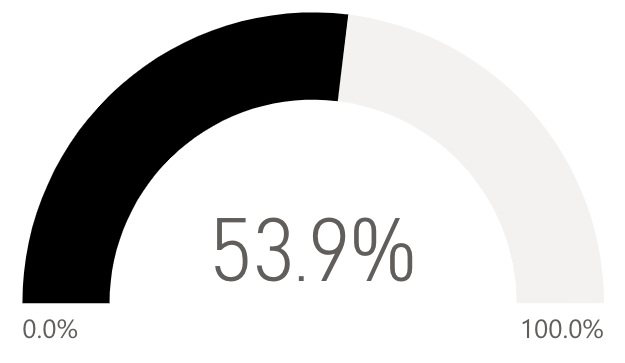
Percentage of Faculty Teaching Online in Spring 2025 Who Completed Online Course Design Academy During the Past 5 Years