Retention Center
Understanding how students engage with your course materials and assessments is key to fostering academic success. Blackboard’s analytics tools empower you to monitor student performance, identify patterns of engagement, and provide timely, personalized support. These insights can help you more efficiently recognize when students may be struggling and offer proactive interventions that can make a meaningful difference.
There are a lot of tools that each provide a different perspective on either aggregated performance for your entire course or a deep dive on individual students.
All Students
These tools provide aggregated analytics or high-level views where you can scan quickly across the performance of all of your students to identify those who may need proactive support.
Course Activity Report
The Course Activity report helps you understand how well your students are performing and how much they are interacting with your course. You can use this report to identify struggling students based on their overall grade, missed due dates, the number of hours they spend in your course, and the number of days since their last access. Report data is updated every 24 hours in the early morning.
Access the Course Activity Report from the Analytics tab in your course. Use the toggle at the top of the page to switch between the activity scatter plot and the full table view.
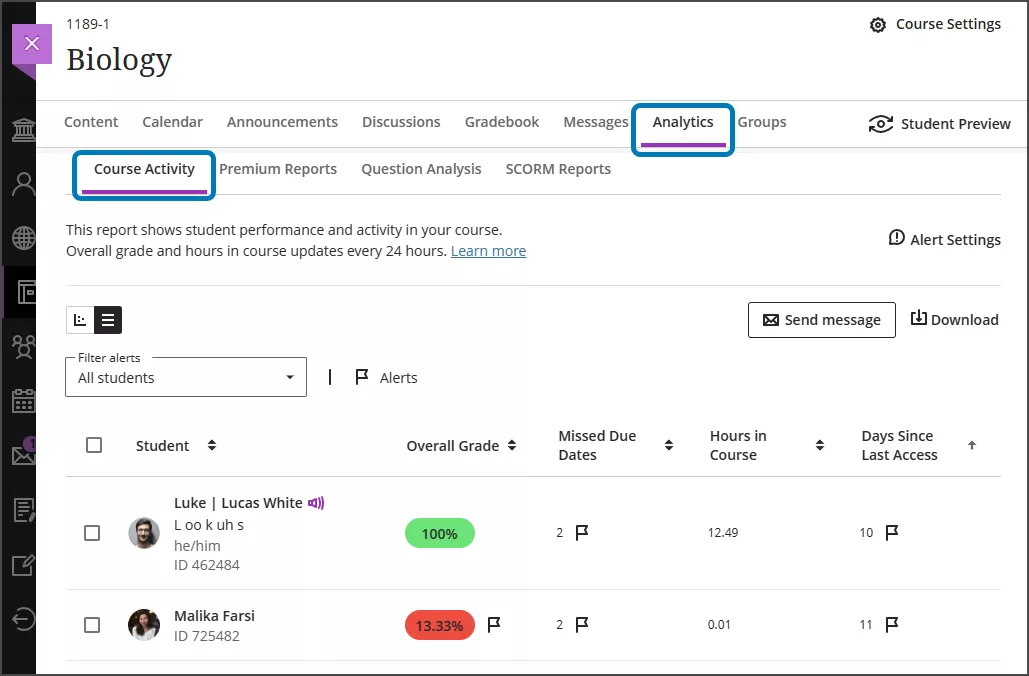
From this page you can:
- View activity as a scatter plot or a table
- Message one or multiple students (messages are sent privately to each student but with the same content)
- Download the table view to a CSV (comma-separated values) file to analyze the data with other tools
- Download the scatter plot as a PDF or image to share information with other instructors or mentors of the course
Student Activity for Assessments
The Student Activity report for a specific assessment lets you see when your students opened, started, and submitted tests and assignments.
To access the student activity report, go to the Course Content page, find the assessment, and click the ellipsis (...), then click Student Activity in the menu.
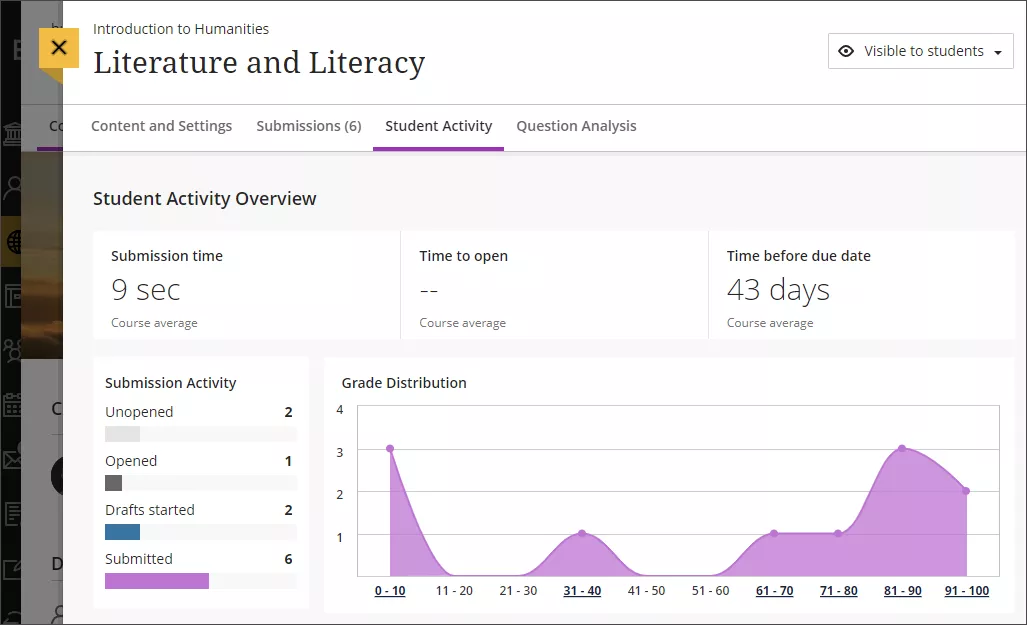
The submission activity report tracks whether each student has opened, started a draft, or submitted the assessment. You can also view a grade distribution and a timeline view of the activity for each student.
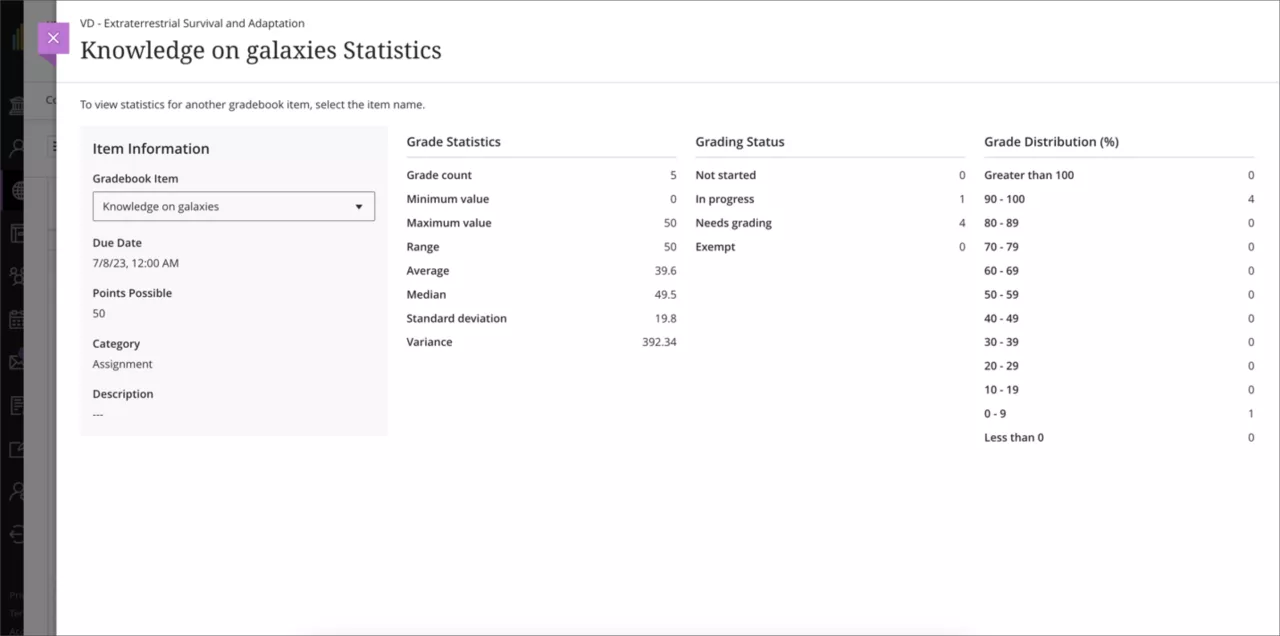
Assessment Statistics
You can view aggregated statistics for the grades on any gradable item in the gradebook, including key metrics such as minimum and maximum value, range, average, median, standard deviation, and variance. This includes Assignments, Tests, Discussions, Journals, and manually-created items. It does not include calculated items at this time.
To access assessment statistics:
- Go to the Grades or Gradable Items tabs in the Gradebook
- Open the menu for the assessment by either clicking the column header (Grades tab) or the ellipsis/... (Gradable Items tab)
- Click Statistics
Individual Student
These tools provide a deep dive into the performance and activity of an individual student, to offer insight on the specific needs of that student.
Student Performance Alerts
In the Gradebook settings (click the Gear icon in the Gradebook), you can configure thresholds for alerts about student performance, such as the number of days since a student was last active in your course, the number of due dates they have missed, and a minimum level for their overall grade. You will receive these alerts on the Activity page of the base navigation.
Individual Student Overview
Use the Student Overview as a single place to get relevant information on a student and personalize your communications with them. You can see how your students have performed over time with analytics. You can also use the message feature to quickly follow-up with a student about any of the information on the Student Overview.
The Student Overview's header includes important information about your students. You'll find:
- Student name
- Date the student last accessed your course
- Overall grade, if have configured the calculation
- Accommodations, if you have added any for due dates or time limits
The Student Overview provides an in-depth view of the Grades and Progress for the student as well as a detailed Activity Log, including whether and when they opened each item in your course.
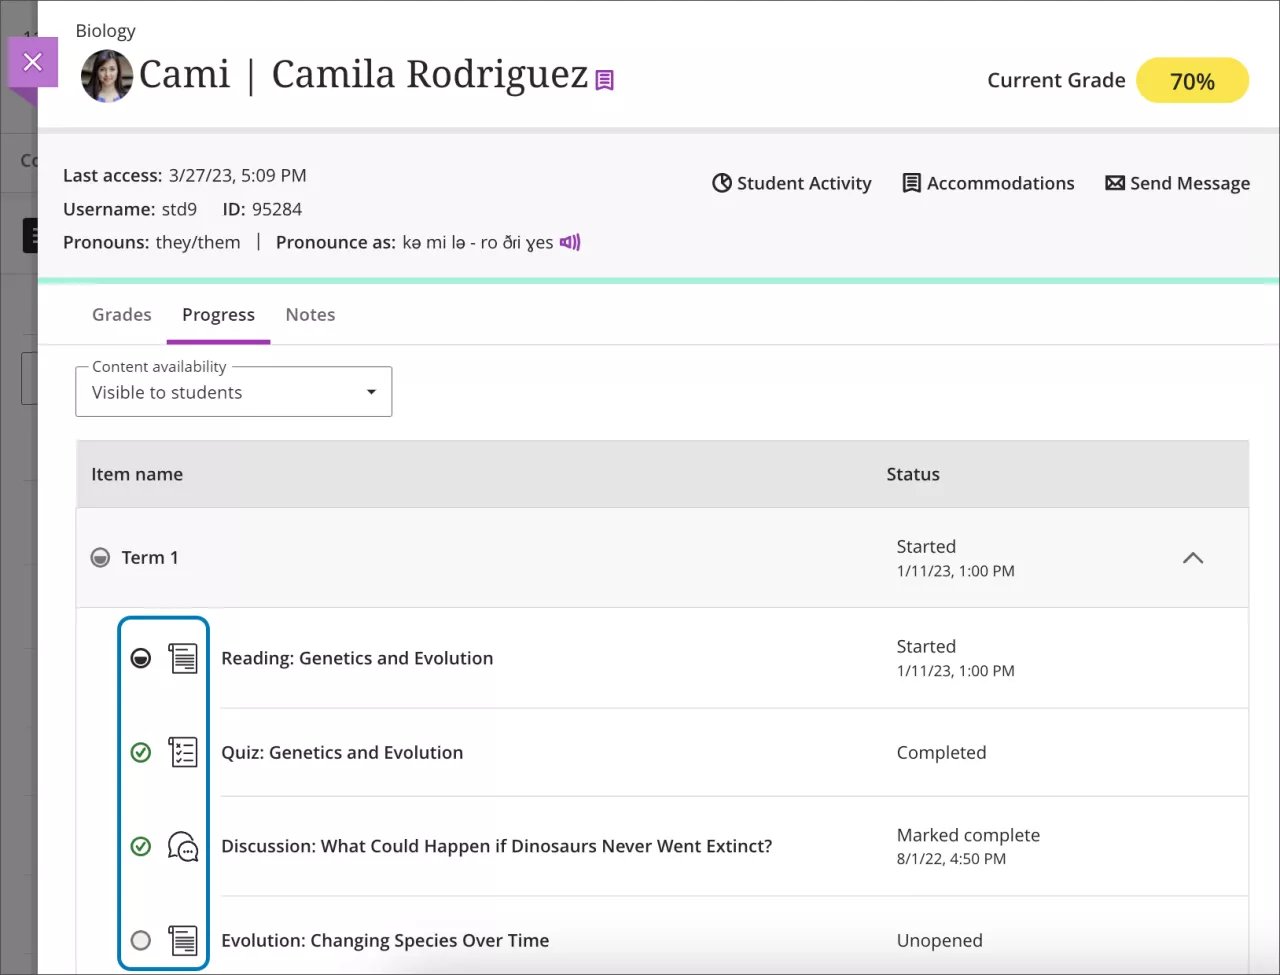
You can access the Student Overview through five different locations:
- Gradebook on the Grades or Students tabs
- Roster
- Messages
- Discussions
- Table view of the Course Activity report
From any of these access points, click the student's name to bring up the Student Overview.
Individual Student Activity Details
The Student Activity Details is an individualized version of the Course Activity report. It provides you with analytics for a single student's performance in your course, such as their time spent in your course and changes in overall grade from week to week. Report data is updated every 24 hours in the early morning.
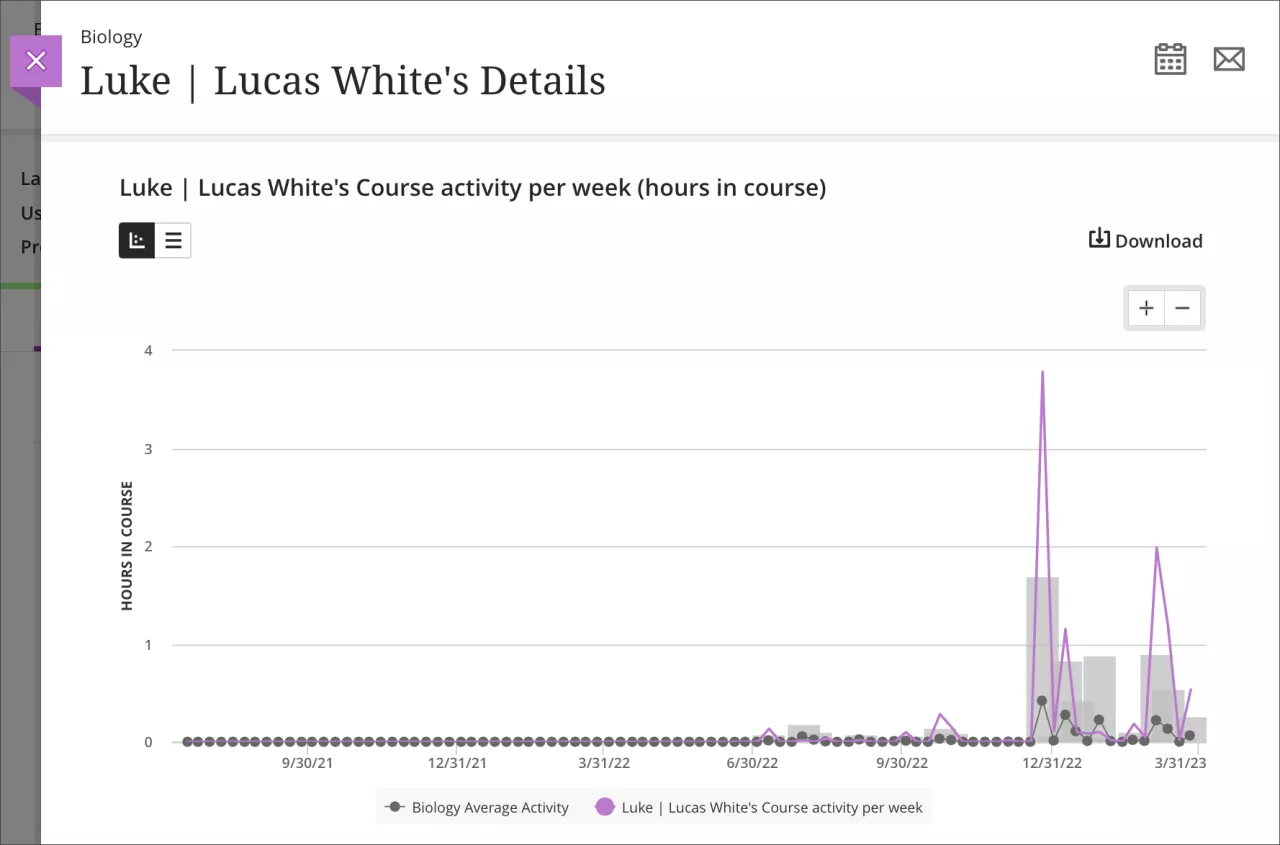
Access the individual report from the Student Overview page by clicking the Student Activity link in the report header.
Individual Student Activity Log
Reviewing student activity helps inform decisions in academic disputes and aids in troubleshooting. You can also analyze the course participation of students at risk. The student activity log is available for the past 140 days and can take up to 20 minutes to update from the last time a student performance an action.
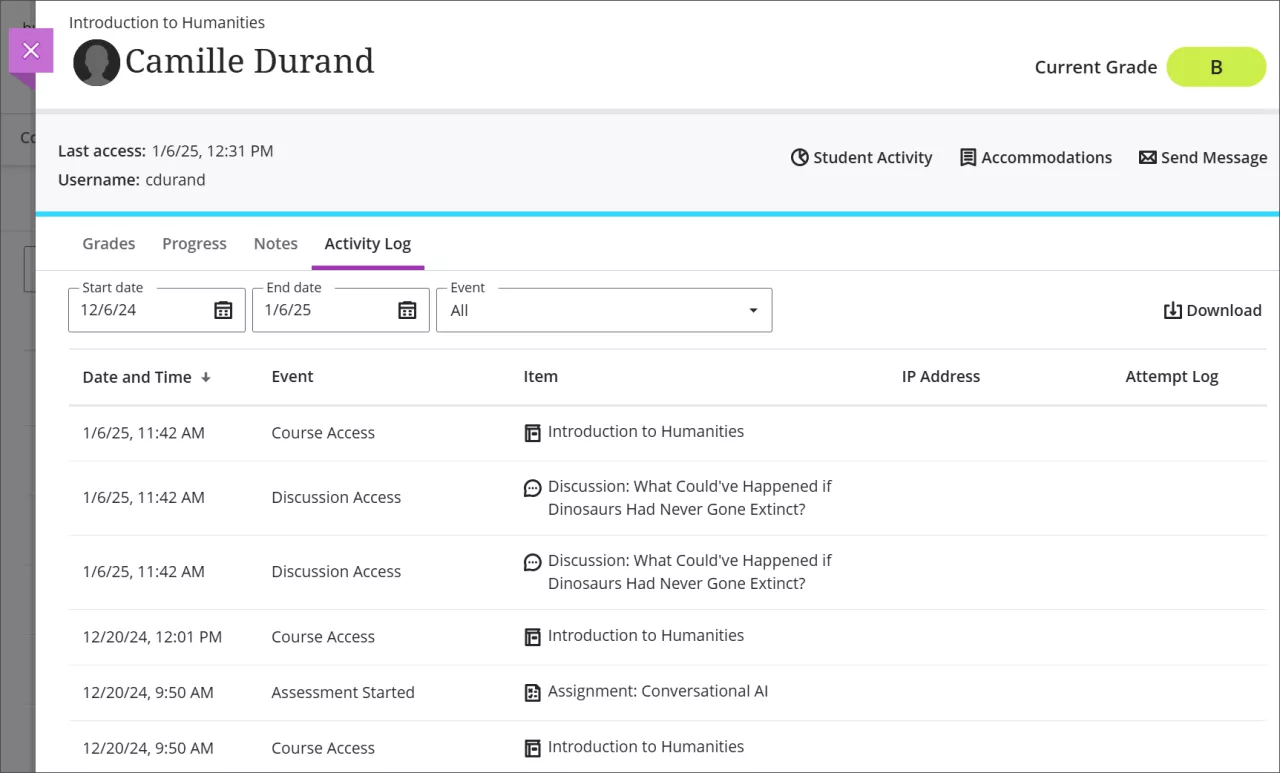
The following events can be found in the log:
- Course Access
- Content Access
- Assessment Started
- Assessment Draft saved
- Assessment Submitted
- Assessment Auto-submitted
- Discussion Access
- Discussion Draft saved
- Discussion Edit
- Discussion Reply
- Discussion Response
- Document Access
- Journal Access
- LTI Item Access
- SCORM item Access
You can filter the log to focus on specific events and download the log for offline analysis. Only the first 1000 events are downloaded, so you may need to use filters and change dates if there is a large amount of activity.
Get Help
Technical Support and Student Help
Division of IT Service Desk815-753-8100
servicedesk@niu.edu