Understanding Diagrams and Graphs
Diagrams and charts are important because they present information visually. The adage “a picture is worth a thousand words” applies when it comes diagrams and charts. This guide provides a few hints on understanding information visually.
Overview
- Don’t skip over diagrams and graphs when reading!
- These visual aids provide summaries or can illustrate a complex process; understanding how to read them is a very efficient way to learn material.
- When tackling diagrams or graphs, pay attention to:
- Captions: What clues about the illustration can you gain from the general description?
- Labels: Can you define or describe the items labeled? If not, reread the text.
- Directionality: Are there arrows, numbers or letters that orient the illustration?
- The Big Picture: Do you notice any trends in data? Can you draw conclusions about relationships among items on a diagram?
Practice
Review the two examples provided. By answering the questions for each, you’ll see how much information can be gleaned from diagrams and graphs.

Graph 1 Questions
- What information does this diagram provide?
- How do the arrows help illustrate the process depicted in the diagram?
- How do the colors of the arrows and the text help organize the facts?
Courtesy: climatechange.umaine.edu
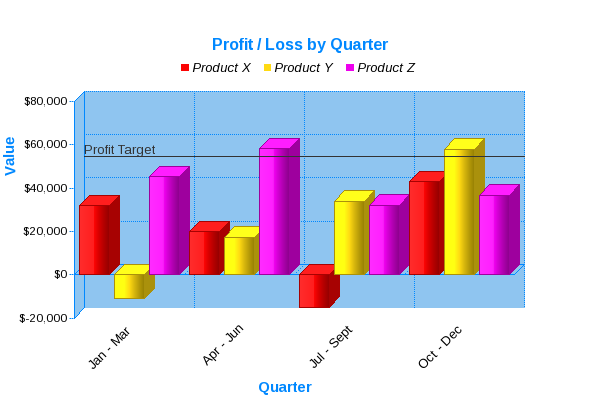
Graph 2 Questions
- What information does this graph provide?
- Note the labels in the X and Y Axis, as well as the location of the “Profit Target” line.
- What does this graph tell you about the performance of the three products over the course of a year?
Courtesy: JPowered
Studying with Diagrams and Graphs
- Start assigned readings by first reviewing any visual aids provided. This will lay the foundation for understanding the meat of your reading.
- Review them again right before class. This will help prepare you for lecture.
- After you have completed a reading assignment, create a visual representation that demonstrates your understanding. This active learning strategy is an effective way to transfer your new learning to your long-term memory.
Developed and shared by The Learning Center, University of North Carolina at Chapel Hill.