- STEM IE
- Activity Settings
- STEM IE Research Findings
STEM IE Research Findings
Our analysis of time use and
We describe activity settings in three ways. First, we determined how much time was spent doing the following activities: Practicing Basic Skills (e.g., completing worksheets, doing drills); Program Staff Led Presentations (e.g., demonstrations, lectures); Field Trip/Guest Speaker Presentations (e.g., demonstrations, lectures); Lab Activity (e.g., collecting and/or analyzing data to learn about a phenomenon); Creating a Product (e.g., building or making); or not STEM-based (e.g., off-task unstructured, physical activity breaks, ice-breaker/relationship building). Second, we determined with whom youth were working: individually, large group, or small group. This aspect of the coding was important because it indicated how much time youth had to collaborate and interact with one another while learning. Collaborating and building relationships with others is an important goal of ISL programs and contributes to STEM learning. Third, we determined where the activity took place: indoors or outdoors, program space or community space, and whether they were in a vehicle. The activity settings were coded from the videotape and validated by entries in the observer s field notes.
We examined how program activities were related to youths perceptions of their experiences in the program. In particular, we looked at youth reports of their engagement, their perceptions of their learning, and how challenging and relevant their experiences were in
Time Use
Overall Time Spent in Activities and Settings
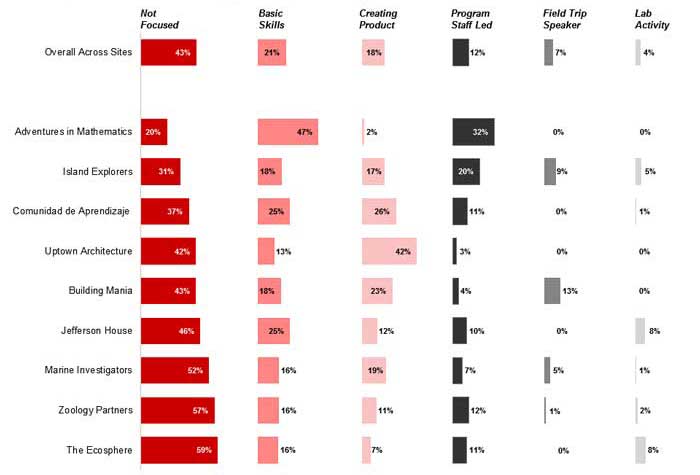
As shown in Figure 1, during scheduled STEM learning time, there was a significant amount of time (43% on average) during which participants were not focused on STEM content or activities, although this varied significantly across both programs and individual ALs (although individual are not shown in the figure). This included time that was used for other purposes (ice-breaker/relationship building, physical activity breaks) as well as
- Transitions both within and between settings.
- Youth finish at different times and those finished first do not have alternative activities.
- Materials are not prepared in advance.
- Directions are not clear, and (e) ice-breaker or "get to know you" activities that build relationships are embedded in the time allocated to STEM content.
Programs also tended to vary substantially in the amount of time dedicated to supporting basic skills development, typically in mathematics; creating a product; and the degree to which activities were staff led. Each of these three activity types
Figure 1. Activities that were not focused on STEM were the most common, on average.
Otherwise, activities differed greatly among the sites. Adventures in Mathematics spent the most time on basic skills and staff-led activities, while Uptown Architecture spent the most amount of time creating products. Very little time was spent across sites on lab activities.

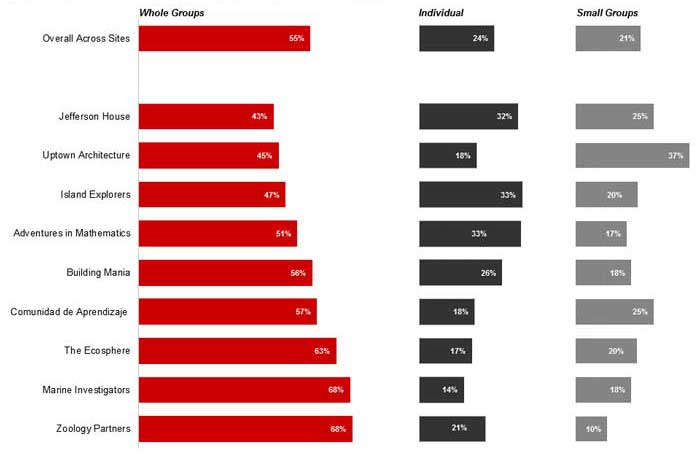
As shown in Figure 2, a distinct minority of the time was spent in collaborative activities. The majority of time was spent in whole-group activities. Youth worked by themselves approximately 24% of the time and in small groups about 21% of the time, although this did vary by program.
Figure 2. On average across all sites,
However, opportunities to collaborate in different grouping

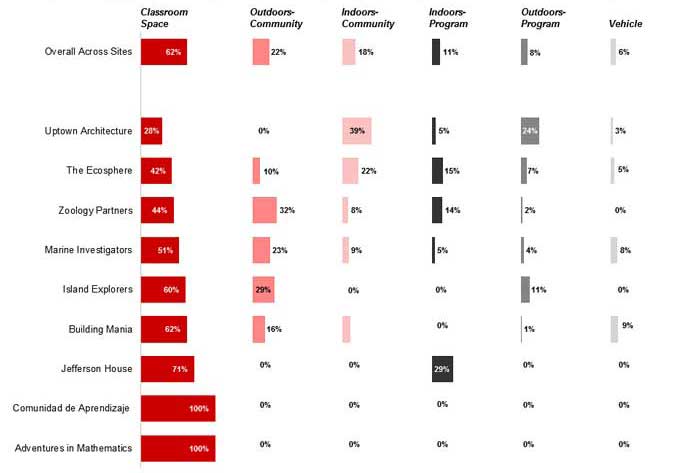
Figure 3. The classroom space was, by far, the most utilized location for STEM activities.
There was some variation in other locations that were used, Uptown Architecture spent the least time in classrooms, spending their time

How Program Activities Were Related to Youth Experience
Creating a product
Youth reported substantially higher learning when they were participating in activities meant to develop basic skills than when doing other activities. They also saw this activity as relevant perhaps because it would be useful to them in school. They did not report being particularly challenged by basic skills activities, however.
Youth reported that what they were doing had higher relevance to them when listening to a field trip speaker than they reported during any other activity. This response highlights the importance of engaging community partners in youth activities.